Best Application Performance Monitoring (APM) Tools
Best application performance monitoring tools includes Site24x7, Stackify Retrace, AppDynamics, Dynatrace, and SmartBear TestComplete. These APM tools ensure optimal performance, monitor end-to-end transaction performance, establish metric baselines for performance, benchmark the competition, etc.


No Cost Personal Advisor
List of 20 Best Application Performance Monitoring Tools
Category Champions | 2024
Full stack monitoring from the cloud
Site24x7 is one of the best APM tools that offers FTP Monitoring, Virtual Machine Monitoring, Process/Workflow Automation, Root-Cause Diagnosis, etc., features. It is a comprehensive monitoring platform that covers servers, websites, applications, networks, and cloud services. It is cloud-based and supports users in 15 languages globally, working for system administrators, developers, engineers, or IT admins. Read Site24x7 Reviews
Explore various Site24x7 features, compare the pricing plans, and unlock the potential of seamless operations by selecting the right software for your business.
Features
View all Site24x7 Features- Maintenance Scheduling
- FTP Monitoring
- Email Monitoring
- Performance Metrics
- Bandwidth Monitoring
- Event Logs
- Uptime Monitoring
- Alerts Notifications
Pricing
Site24x7 Caters to
- StartUps
- SMBs
- Agencies
- Enterprises
Emergents | 2024
A complete cloud infrastructure platform for migra
Oracle Cloud Infrastructure is an application performance software providing end-to-end monitoring solutions for all kinds of businesses. It offers pay-as-you-grow plans, supporting the scaling of firms. Its best features are Data Security, Online Analytical Processing (OLAP), Multi-Cloud Management, Data Governance, etc. It comes with a hybrid deployment model and works to improve speed while reducing costs. Learn more about Oracle Cloud Infrastructure
Explore various Oracle Cloud Infrastructure features, compare the pricing plans, and unlock the potential of seamless operations by selecting the right software for your business.
- Data warehousing
- Online Analytical Processing (OLAP)
- AI / Machine Learning
- Application Development
- Data Security
- Data Governance
- Big Data Analytics
- Analytics
Oracle Cloud Infrastructure Caters to
- StartUps
- SMBs
- Agencies
- Enterprises
Contenders | 2024
Real-time error management for applications
Dynatrace monitors applications, servers, cloud environments, and infrastructure, supplying real-time metrics and bug fixes. One of the most capable application performance monitoring tools for improved productivity and efficiency, it offers customers support in eight languages. It has exciting features like Resource Management, Server Performance, Release Management, Diagnostic Tools, Performance Control, etc. Read Dynatrace Reviews
Explore various Dynatrace features, compare the pricing plans, and unlock the potential of seamless operations by selecting the right software for your business.
Features
View all Dynatrace Features- Performance Control
- Trace individual transactions
- Release Management
- Root-Cause Diagnosis
- Diagnostic Tools
- Resource Management
- Full Transaction Diagnostics
- Server Performance
Dynatrace Caters to
- StartUps
- SMBs
- Agencies
- Enterprises
Contenders | 2024
APM monitoring tool for usage optimization & CPU utilization
A powerful tool for IT professionals and developers, New Relic gives exceptional value for money. Starting with a free tier, it has plans for engineering teams of all sizes. Features like Change Tracking, CodeStream, Network Monitoring, New Relic Grok, System Health, Host Monitoring, etc., make it one of the best application performance monitoring tools. Read New Relic Reviews
Explore various New Relic features, compare the pricing plans, and unlock the potential of seamless operations by selecting the right software for your business.
Features
View all New Relic Features- Transaction Monitoring
- Performance Control
- Root-Cause Diagnosis
- Baseline Manager
- Resource Management
- Performance Metrics
- Event-Based Notifications
- Server Performance
New Relic Caters to
- StartUps
- SMBs
- Agencies
- Enterprises
Emergents | 2024
Optimize complex applications with cloud monitoring features
AppDynamics is one of the application performance management tools that contains functionalities like CPU Monitoring, Applications Management, Virtual Machine Monitoring, Event Logs, etc. This server monitoring tool connects with organizations’ core operating systems to combine content and business transaction. It improves CPU utilization, making processes more efficient and saving costs. Read AppDynamics Reviews
Explore various AppDynamics features, compare the pricing plans, and unlock the potential of seamless operations by selecting the right software for your business.
Features
View all AppDynamics Features- Applications Management
- CPU Monitoring
- Alerts Notifications
- Scheduling
- Database Servers
- Event Logs
- Email Monitoring
- Real Time Comparisons
AppDynamics Caters to
- StartUps
- SMBs
- Agencies
- Enterprises
Contenders | 2024
Full-stack code observation with APM monitoring tool
Datadog is among the application performance management solutions that support companies with cloud-scale monitoring. Using AI for IT operations, it is also surprisingly cost-effective. Its plans can be customized by business scale and even start with a free option. Its features include Real Time Monitoring, Event-Based Notifications, Drill Down, Report Export, etc. Read Datadog Reviews
Explore various Datadog features, compare the pricing plans, and unlock the potential of seamless operations by selecting the right software for your business.
Features
View all Datadog Features- Drill Down
- Customizable Dashboard
- FTP Monitoring
- Real Time Monitoring
- Uptime Reporting
- Performance Metrics
- Report Export
- Dashboard
Pricing
Free
$ 0
Up to 5 Hosts
Pro
$ 15
Per Host/ Month
Datadog Caters to
- StartUps
- SMBs
- Agencies
- Enterprises
Contenders | 2024
Easy code profiling for system admin & network engineers
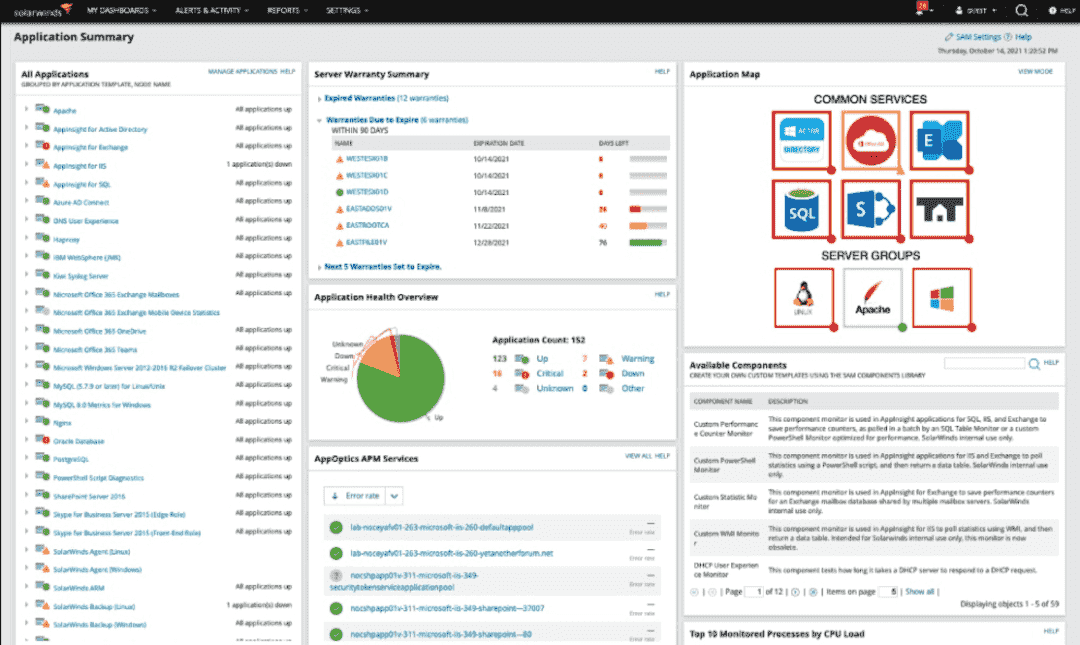
SolarWinds is one of the best APM software. It is a database software that incorporates asset tracking, backup, and remote access apart from monitoring. Businesses use its database system for creating, retrieving, updating, and managing their data. It also has other exciting features like Uptime Monitoring, User Activity Monitoring, Alerts Notifications, Storage Optimization, etc. Read SolarWinds Reviews
Explore various SolarWinds features, compare the pricing plans, and unlock the potential of seamless operations by selecting the right software for your business.
Features
View all SolarWinds Features- Email Monitoring
- Alerts Notifications
- User Activity Monitoring
- Multi-User
- Uptime Monitoring
- CPU Monitoring
- Real Time Monitoring
- Scheduling
Pricing
Starter
$ 2995
Onetime
SolarWinds Caters to
- StartUps
- SMBs
- Agencies
- Enterprises
Contenders | 2024
Indexing & automatic data enrichment for app performance
An outstanding log management system, Splunk Light is one of the leading application performance tools. It is a scalable tool for businesses of all sizes, free to download, and easy to set up. It helps them collect, index, monitor, alert, and report data. Features include Event Logs, Data Visualization, Network Logs, Syslogs, Web Logs, etc. Read Splunk Light Reviews
Explore various Splunk Light features, compare the pricing plans, and unlock the potential of seamless operations by selecting the right software for your business.
Features
View all Splunk Light Features- Syslogs
- Data Visualization
- Web Logs
- Event Logs
- Network Logs
Splunk Light Caters to
- StartUps
- SMBs
- Agencies
- Enterprises
Contenders | 2024
Simulate user experience with application monitoring
BMC Software is one of the web application performance monitoring tools. It has dozens of helpful features for IT Asset Management by companies. It provides functions like Asset Management, Tax Management, Task Tracking, Asset Sharing, Inventory Tracking, etc. Its features help businesses with the visibility, compliance, and control of their IT assets. Read BMC Software Reviews
Explore various BMC Software features, compare the pricing plans, and unlock the potential of seamless operations by selecting the right software for your business.
Features
View all BMC Software Features- Ticket Management
- Asset Tracking
- Filtered Search
- Asset Sharing
- Tax Management
- Task Tracking
- Document Management
- Asset Management
BMC Software Caters to
- StartUps
- SMBs
- Agencies
- Enterprises
Emergents | 2024
Code improvement with application performance management
Stackify Retrace is one of the most powerful application monitoring tools. A highly budget-friendly platform, it offers features like Root-Cause Diagnosis, Full Transaction Diagnostics, Resource Management, Debugging, etc. It helps companies monitor, diagnose, and enhance the performance of their IT assets via troubleshooting, bug search, and code improvement on the same platform. Learn more about Stackify Retrace
Explore various Stackify Retrace features, compare the pricing plans, and unlock the potential of seamless operations by selecting the right software for your business.
Features
View all Stackify Retrace Features- Diagnostic Tools
- Debugging
- Full Transaction Diagnostics
- Reporting/Analytics
- Trace individual transactions
- Server Performance
- Filtering
- Web App Development
Pricing
Retrace Production
$ 25
Per Month
Retrace Dev/Test
$ 10
Per Month
Stackify Retrace Caters to
- StartUps
- SMBs
- Agencies
- Enterprises
Emergents | 2024
Tools by Raygun
Raygun, one of the top APM tools, offers features like Code Filtering, Real-time Analytics, Custom Monitoring Rules, Code-level Diagnostics, etc. It is a highly visual software that provides in-depth and detailed reporting of errors via an integrated platform. Companies can find issues, fix them, and measure the impact faster and more accurately. Learn more about Raygun
Explore various Raygun features, compare the pricing plans, and unlock the potential of seamless operations by selecting the right software for your business.
Raygun Caters to
- StartUps
- SMBs
- Agencies
- Enterprises
Contenders | 2024
Tools by IBM
IBM Cloud Object Storage is among the application performance monitoring tools that also provide high-quality cloud storage for data. From the house of IBM, it automates application resource management. Its features include Zero Human Configuration, Debugging, Real-time Demand Management, AI-powered Apps, etc. It offers resource management and storage solutions to all types of companies. Read IBM Cloud Object Storage Reviews
Explore various IBM Cloud Object Storage features, compare the pricing plans, and unlock the potential of seamless operations by selecting the right software for your business.
- Archiving & Retention
- Encryption
- Version Control
- Backup
- Access control
- Data Migration
- File Sharing
- Data Synchronization
IBM Cloud Object Storage Caters to
- StartUps
- SMBs
- Agencies
- Enterprises
Emergents | 2024
Application performance management for end-user monitoring
Riverbed is one of the application performance management tools suitable for businesses of all sizes. It uses Experience Level Agreements to analyze the performance of critical applications and offer valuable solutions to performance challenges. Its features include Real User Monitoring, Open Telemetry Support, Device Management, Connectivity Management, Bandwidth Monitoring, etc. Read Riverbed Reviews
Explore various Riverbed features, compare the pricing plans, and unlock the potential of seamless operations by selecting the right software for your business.
Features
View all Riverbed Features- Connectivity Management
- Bandwidth Monitoring
- Network Analysis
- Network Diagnosis
- Device management
- Dashboard
- Server Monitoring
Riverbed Caters to
- StartUps
- SMBs
- Agencies
- Enterprises
Emergents | 2024
Can handle 50,000 applications at a time
ManageEngine Applications Manager automates tasks like uploading applications, rechecking information, and service delivery. Some of its significant features are Virtual Machine Monitoring, Process/Workflow Automation, Backup Log, Backup Scheduling, Local Server Options, etc. Improving productivity and reducing costs, it is among the most flexible application performance monitoring tools focusing on automation. Learn more about ManageEngine Applications Manager
Explore various ManageEngine Applications Manager features, compare the pricing plans, and unlock the potential of seamless operations by selecting the right software for your business.
- Virtual Machine Monitoring
- Server Monitoring
- Uptime Reporting
- Web Logs
- Event Logs
- Applications Management
- Server Performance
- Performance Metrics
ManageEngine Applications Manager Caters to
- StartUps
- SMBs
- Agencies
- Enterprises
Emergents | 2024
Tools by Micro Focus
When it comes to application performance management solutions, Micro Focus QC is one of the most helpful tools available to developers. Now known as OpenTextTM ALM/Quality Center, it offers Quality Management and Control alongside application management. It is rich in features like Defect Tracking, Risk Management, Parameterized Testing, Requirements-Based Testing, etc. Learn more about Micro Focus QC
Explore various Micro Focus QC features, compare the pricing plans, and unlock the potential of seamless operations by selecting the right software for your business.
Features
View all Micro Focus QC Features- Risk Management
- Test Script Reviews
- Parameterized Testing
- Requirements-Based Testing
- Defect Tracking
Micro Focus QC Caters to
- StartUps
- SMBs
- Agencies
- Enterprises
Contenders | 2024
Automated cloud infrastructure monitoring APM tool
Focusing on prevention, LogicMonitor includes features like Intrusion Detection System, Vulnerability Scanning, Web Threat Management, etc. It is one of the most proactive application monitoring tools with SaaS-based automated monitoring facility that reviews infrastructure, business services, as well as applications. It creates customizable servers and offers a thorough analysis of IT asset tracking data. Read LogicMonitor Reviews
Explore various LogicMonitor features, compare the pricing plans, and unlock the potential of seamless operations by selecting the right software for your business.
Features
View all LogicMonitor Features- Baseline Manager
- SLA Monitoring
- Virtual Machine Monitoring
- Performance Metrics
- Remote Access
- Event Logs
- Internet Usage Monitoring
- Database Servers
LogicMonitor Caters to
- StartUps
- SMBs
- Agencies
- Enterprises
Emergents | 2024
Tools by Draios
Sysdig Cloud is among the best application performance tools for cloud security. It is an open-source software that focuses on runtime insights to offer Vulnerability Management, Posture Management, Entitlement Management, and Threat Detection & Response. Features like In-use Risk Exposure Filter, Machine Learning, Drift Prevention, Threat Feeds, etc., make it a highly innovative tool. Learn more about Sysdig
Explore various Sysdig features, compare the pricing plans, and unlock the potential of seamless operations by selecting the right software for your business.
Sysdig Caters to
- StartUps
- SMBs
- Agencies
- Enterprises
Emergents | 2024
Automated UI testing for application performance management
A modern automation testing tool, SmartBear TestComplete is also one of the APM tools directed at scalability. With features like Intelligent Object Repository, Object Recognition Engine, Script/Scriptless Flexibility, etc., it is a market leader in Automated UI Testing. Coming in three modules for mobile, desktop, and web, it can run on Windows, Web, Android, HTML5, etc. Learn more about SmartBear TestComplete
Explore various SmartBear TestComplete features, compare the pricing plans, and unlock the potential of seamless operations by selecting the right software for your business.
- Performance Control
- Test Case Tracking
- Testing / QA Management
- Ticket Management
- Push Notifications
- Task Management
- Workflow Management
- Testing Management
SmartBear TestComplete Caters to
- StartUps
- SMBs
- Agencies
- Enterprises
Emergents | 2024
Tools by Artica Soluciones Tecnologicas
Pandora FMS is one of the most flexible application performance monitoring tools. It contains a range of interesting features such as Device Auto Discovery, Color Codes/Icons, Hierarchical Mapping, Location-Based Mapping, On-Demand Mapping, etc. With a track record of 15+ years of monitoring, it is known for its adaptability to any organization. Learn more about Pandora FMS
Explore various Pandora FMS features, compare the pricing plans, and unlock the potential of seamless operations by selecting the right software for your business.
Features
View all Pandora FMS Features- Hierarchical Mapping
- Color Codes/Icons
- Web Traffic Reporting
- Uptime Monitoring
- SLA Monitoring
- Bandwidth Monitoring
- Server Monitoring
- On-Demand Mapping
Pandora FMS Caters to
- StartUps
- SMBs
- Agencies
- Enterprises
Emergents | 2024
Tools by Catchpoint Systems
Catchpoint is among the most helpful application monitoring tools for digital experience businesses. With the largest active monitoring network, it can catch issues faster and more accurately, allowing them to be fixed quickly. Its exciting features include Synthetic and Real User Monitoring, Real-time Analytics, FTP Monitoring, Network Resource Management, Full Transaction Diagnostics, etc. Learn more about Catchpoint
Explore various Catchpoint features, compare the pricing plans, and unlock the potential of seamless operations by selecting the right software for your business.
Features
View all Catchpoint Features- Diagnostic Tools
- Baseline Manager
- Mail Server Monitoring
- Real Time Monitoring
- Transaction Monitoring
- Dashboard
- Performance Control
- Event Logs
Catchpoint Caters to
- StartUps
- SMBs
- Agencies
- Enterprises
Get Free Expert Advice

Recent Review
Ensuring optimal performance and dependability is crucial in today's technology-driven world, where digital applications form the foundation of organizations and services. Application Performance Monitoring (APM) tools are useful in this situation. For businesses looking to proactively monitor, identify, and improve the performance of their applications, APM solutions are essential.
APM technologies enable developers, IT operations teams, and business stakeholders to make data-driven decisions, improve user experiences, and uphold high levels of customer satisfaction by giving real-time insights into application activity. APM tools have emerged as a crucial part of the software development lifecycle in this fast-paced and dynamic environment, allowing enterprises to remain competitive, effective, and responsive to the demands of the contemporary digital world.
What are Application Performance Monitoring (APM) Tools?
Application Performance Monitoring (APM) tools are software solutions designed to monitor and manage the performance and availability of applications in real time. These tools provide deep insights into the performance of applications, helping organizations ensure optimal user experiences and seamless functionality.
APM tools collect and analyze various metrics related to application response times, server and database performance, error rates, and user interactions to identify performance bottlenecks and issues. By monitoring application performance, APM tools enable IT teams to proactively detect and resolve problems before they impact end-users, reducing downtime and improving overall application reliability.
APM tools offer end-to-end visibility into the entire application stack, from front-end components to backend services and databases. They can trace individual user transactions through different application components, making it easier to pinpoint the root cause of performance problems and optimize application code.
Additionally, APM tools often include features like code-level diagnostics, real user monitoring (RUM), alerting, and reporting, which provide developers, IT operations, and business stakeholders with valuable insights into application health and user experiences. By streamlining the monitoring and troubleshooting process, APM tools empower organizations to deliver high-performing applications, enhance customer satisfaction, and drive business success.
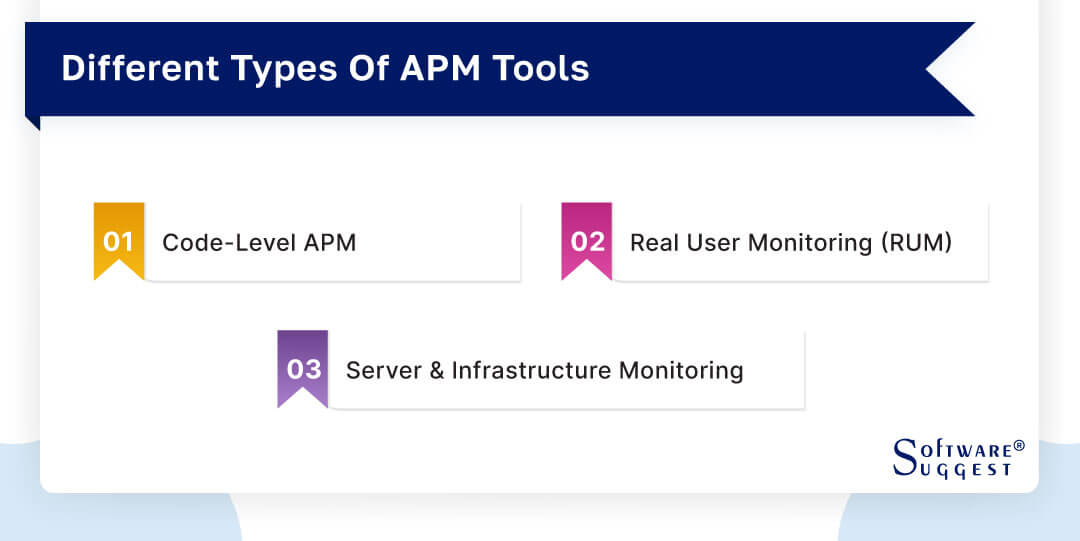
Types of Application Performance Monitoring (APM) Tools
Several types of Application Performance Monitoring (APM) tools are available, each catering to specific aspects of application performance monitoring software and management. Some of the key types of APM tools include -
-
Code-Level APM
These tools focus on providing in-depth insights into application code execution. They allow developers to analyze the performance of individual lines of code, identify bottlenecks, and optimize code for better application performance.
-
Real User Monitoring (RUM)
RUM APM tools track user interactions with the application in real time. They capture data on user experiences, such as page load times, clicks, and transactions, to understand how users are interacting with the application and to identify any performance issues from the end-user perspective.
-
Server and Infrastructure Monitoring
These APM tools concentrate on monitoring the performance and health of servers, virtual machines, and other infrastructure components that support the application. They provide insights into resource utilization, server response times, and overall infrastructure health.
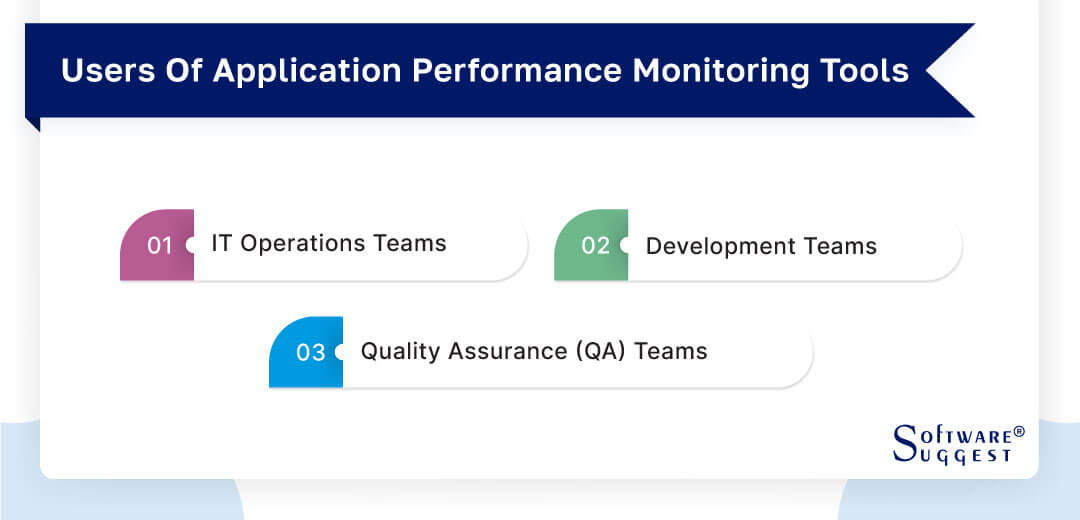
Who Uses APM Tools?
Application Performance Monitoring (APM) technologies are used by various stakeholders in an organization to learn more about how well their infrastructure and applications are performing. The stakeholders involved include:
-
IT Operations Teams
IT operations teams are responsible for ensuring the availability, reliability, and performance of the organization's applications and IT infrastructure. They use APM tools to monitor the health of servers, databases, and network components, as well as to detect and resolve performance issues proactively. APM tools help IT operations teams identify bottlenecks and optimize resource utilization, minimizing downtime and maximizing system efficiency.
-
Development Teams
Developers are essential to the creation and upkeep of programs. To acquire code-level insights into application performance, they employ APM technologies. With the use of these tools, developers can quickly locate performance bottlenecks in their code, monitor how certain functions are executed, and debug issues. Development teams can optimize application code and enhance overall application performance by employing APM technologies.
-
Quality Assurance (QA) Teams
Applications must be tested to make sure they adhere to quality standards and function as intended. For QA teams to track application performance during testing and spot any performance-related flaws or problems, APM tools are invaluable. Before deployment, QA teams can check application performance and confirm that it complies with performance criteria by utilizing APM tools in their testing process.
Benefits of Best Application Performance Monitoring (APM) Tools
The implementation of the best Application Performance Monitoring (APM) tools offers numerous benefits to businesses by enabling them to effectively monitor and optimize the performance of their applications and IT infrastructure. These tools provide valuable insights into application behavior, helping organizations deliver a seamless user experience and achieve better business outcomes. Here are some key benefits of using the best APM tools -

-
Improve Application Performance
APM tools provide real-time monitoring and analytics, allowing businesses to identify and address performance bottlenecks promptly. By optimizing application code, database queries, and server configurations, organizations can significantly improve application performance, leading to faster response times and smoother user interactions.
-
Increase Consumer Satisfaction
With APM tools in place, businesses can proactively detect and resolve issues that may impact user experiences. Ensuring consistent and reliable application performance enhances customer satisfaction, fostering loyalty and positive brand perception.
-
Better User Experience
APM tools offer insights into how users interact with applications, enabling organizations to identify areas of improvement and refine the user interface. By prioritizing user experience enhancements, businesses can retain and attract more users, resulting in increased engagement and usage.
-
Reduces Downtime
APM tools enable IT teams to proactively detect anomalies and performance issues, allowing them to address potential problems before they escalate into major incidents. By minimizing downtime and quickly resolving issues, businesses can maintain the continuous availability of their applications and services, ensuring uninterrupted operations and reducing revenue loss.
-
Enhanced Operational Efficiency
APM tools provide valuable data and insights that help IT teams optimize resource allocation and infrastructure utilization. By streamlining troubleshooting processes and resolving issues faster, organizations can improve overall operational efficiency and reduce the time spent on manual performance monitoring and problem resolution.
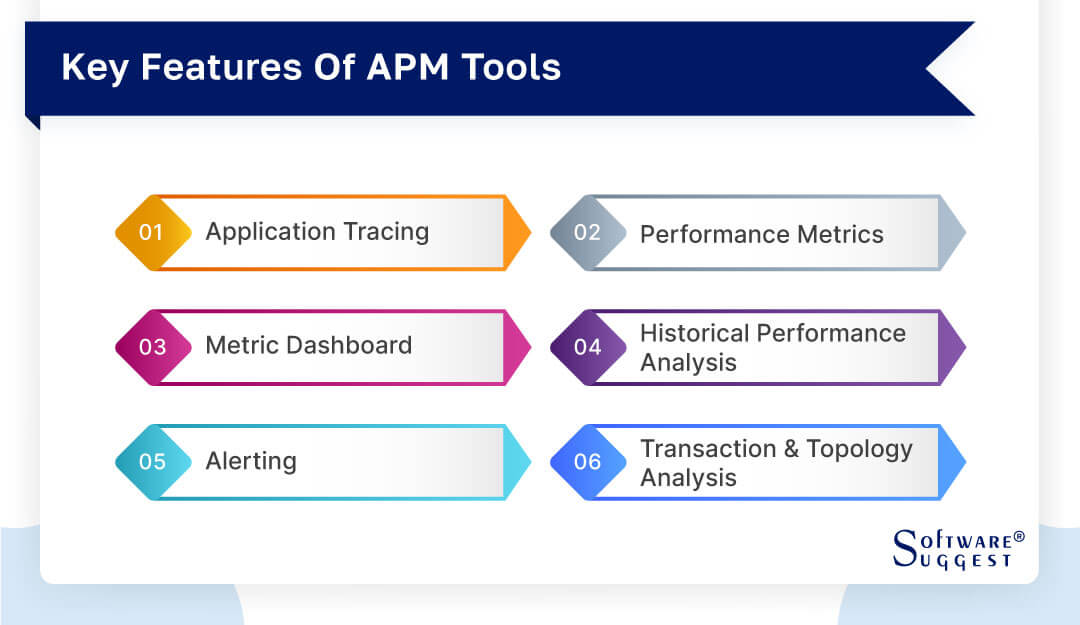
Features of Best Application Performance Monitoring (APM) Tools
Application Performance Monitoring (APM) tools are essential software solutions that play a vital role in ensuring the smooth and efficient functioning of applications. With the increasing complexity of modern applications and IT infrastructures, APM tools offer comprehensive features to help organizations monitor, analyze, and optimize application performance.
By providing real-time insights into application behavior, APM tools empower businesses to deliver exceptional user experiences, minimize downtime, and improve overall operational efficiency. Let's explore some key features of APM tools:
-
Application Tracing
One of the key features of the best Application Performance Monitoring (APM) tools is application tracing. APM tools trace individual user transactions as they move through different components of the application, providing end-to-end visibility into the application's performance. This allows organizations to understand the flow of transactions, track response times, and identify any bottlenecks or performance issues that may be affecting the application's overall responsiveness. Application tracing is essential for pinpointing the root cause of performance problems and optimizing the application code for better efficiency.
-
Performance Metrics
APM tools collect and analyze a wide range of performance metrics from various components of the application stack. These metrics may include response times, throughput, error rates, CPU and memory utilization, database performance, and more. By tracking and analyzing these metrics in real time, businesses gain valuable insights into how the application is performing and how resources are being utilized. Performance metrics help organizations identify patterns, trends, and abnormalities, enabling proactive monitoring and quicker problem resolution.
-
Metric Dashboard
The best APM tools offer a user-friendly and customizable metric dashboard that displays real-time performance data in a visually appealing manner. The dashboard provides a consolidated view of critical performance metrics, allowing IT teams to monitor the health of the application at a glance. Customizable dashboards enable organizations to tailor the display to their specific needs, ensuring that relevant performance metrics are easily accessible and actionable.
-
Historical Performance Analysis
APM tools not only provide real-time insights but also offer historical performance analysis capabilities. They store performance data over time, allowing organizations to compare current performance with past trends. Historical analysis helps identify long-term patterns, seasonality, or recurring issues that may not be immediately evident in real-time monitoring. This feature assists IT teams in making informed decisions, conducting performance audits, and planning future improvements.
-
Alerting
APM tools incorporate robust alerting mechanisms to notify IT teams when performance thresholds are breached or when anomalies are detected. Customizable alerting rules allow organizations to set specific conditions for triggering alerts, ensuring that the right people are notified promptly when critical issues arise. Alerting empowers IT teams to respond proactively to performance degradation, reducing downtime, and mitigating potential business impact.
-
Transaction and Topology Analysis
APM tools offer transaction analysis capabilities to track individual user requests as they traverse through various application components and services. Transaction analysis helps identify specific steps where delays or errors occur, aiding in targeted troubleshooting and optimization efforts. Additionally, the best APM tools provide topology analysis, visualizing the relationships and dependencies between different components of the application. This feature allows IT teams to understand the overall architecture and how changes in one component can impact others, streamlining problem identification and resolution.
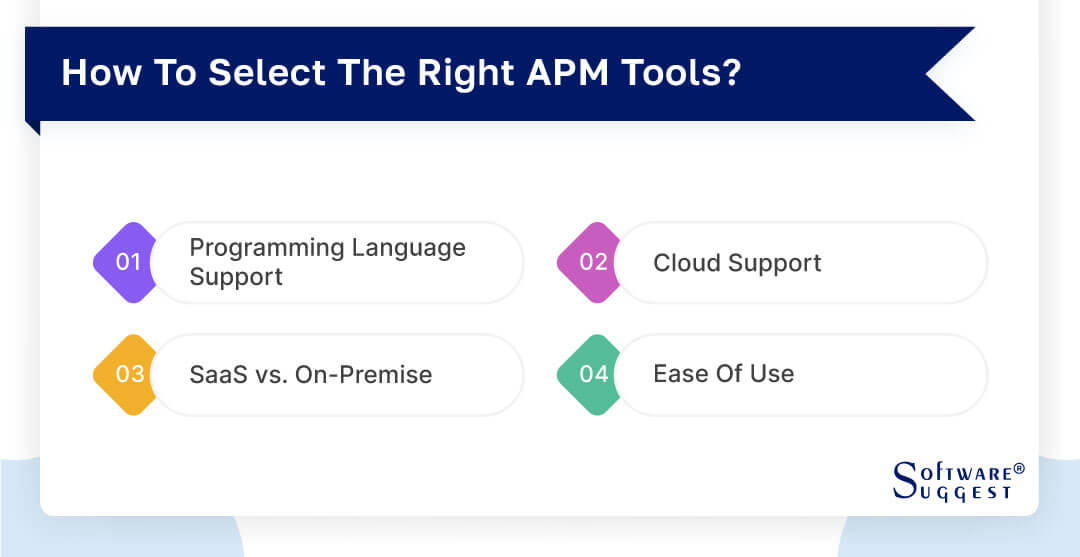
How to Choose the Right Application Performance Monitoring Tools?
Selecting the right Application Performance Monitoring (APM) tools is crucial for businesses to ensure the optimal performance of their applications and deliver seamless user experiences. With a wide array of APM tools available in the market, making the right choice requires careful consideration of several factors. Here, we will explore key points to consider when choosing the right APM tools to meet your organization's specific needs.
-
Programming Language Support
One of the critical factors to consider when choosing APM tools is their compatibility with the programming languages used in your applications. Ensure that the APM tool supports the programming languages that your applications are built on. Look for comprehensive language coverage, including popular languages like Java, Python, .NET, Node.js, Ruby, and more. The APM tool should offer robust instrumentation and monitoring capabilities for each supported language to gain detailed insights into application performance.
-
Cloud Support
As businesses increasingly adopt cloud-based infrastructures, it is essential to select APM tools that are cloud-ready. Ensure that the APM solution seamlessly integrates with your cloud environment and supports monitoring of applications deployed on various cloud platforms like AWS, Azure, Google Cloud, etc. A cloud-supported APM tool should provide real-time visibility into the performance of applications running in dynamic cloud environments, helping you optimize resource utilization and enhance application scalability.
-
SaaS vs. On-Premise
Consider whether you prefer a Software-as-a-Service (SaaS) or an on-premise APM solution. SaaS-based APM tools are hosted and managed by the provider, offering easier deployment, automatic updates, and scalability. On the other hand, an on-premise APM tool is installed and managed within your organization's infrastructure, providing greater control and customization. Evaluate your organization's security, compliance, and infrastructure requirements to determine the best deployment option for your APM needs.
-
Ease of Use
An APM tool should be user-friendly and easy to navigate for both developers and IT operations teams. Look for a tool with an intuitive interface, clear dashboards, and streamlined workflows. It should offer customizable views and reports, enabling users to focus on relevant performance metrics and troubleshoot effectively. The ease of use ensures that your teams can quickly adopt the tool and gain maximum value from its features without a steep learning curve.
Top 5 Application Performance Monitoring (APM) Tools Comparison
|
Name
|
Free Trial
|
Demo
|
Pricing
|
|---|---|---|---|
|
15 Days |
Yes |
Starting price at $6/month/CPU Core | |
|
14 Days |
Yes |
On Request |
|
|
15 Days |
Yes |
Custom Pricing |
|
|
30 Days |
Yes |
On Request |
|
|
14 Days |
Yes |
Starting price at $9.99/month(Consumption-Based) |
Tools for Application Performance Monitoring (APM) are essential for companies that want to guarantee optimal application performance, improve user experiences, and keep their IT operations stable. Choosing the best APM tool might be difficult due to the abundance of options accessible. Here is the list of top application performance monitoring tools, which stand out for their extensive feature sets, approachable user interfaces, and established track records in the market.
1. AppDynamics
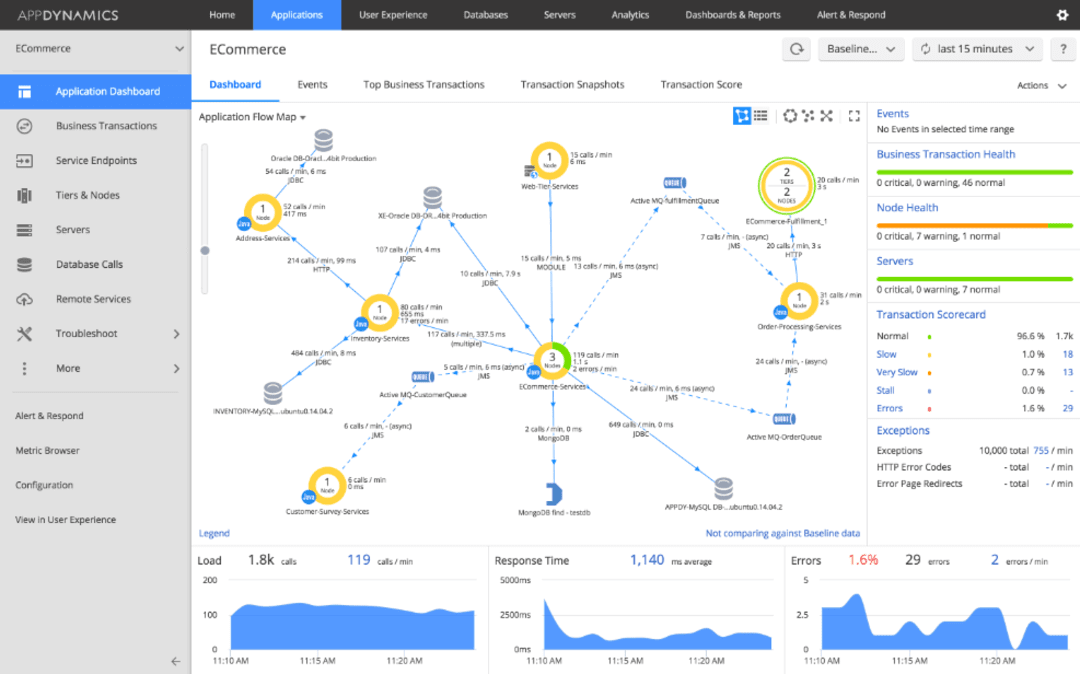
The top Application Performance Monitoring (APM) solution AppDynamics was created to assist enterprises in tracking and enhancing the performance of their infrastructure and applications. The importance of making ensuring these programs function smoothly and efficiently grows as organizations rely more and more on software applications to offer services and goods.
Developers, IT operations teams, and business stakeholders may receive real-time visibility into the performance and health of their apps with the help of AppDynamics' extensive feature set. It offers profound insights into every component of the application stack, including the user interface, the source code, the backend servers, databases, and third-party services.
- Real-time monitoring
- End-to-end Transaction tracing
- Code-level diagnostics
- Deep dive diagnostics
- Business transaction monitoring
- Alerting and notifications
- Application topology visualization
- Performance baselines and anomaly detection
- A graphical framework for comprehending business performance is offered by AppDynamics.
- AppDynamics offers service assistance and connects call performance to an external system.
- The team periodically uses AppDynamics to improve system performance.
- Real-time business indicators are provided by the software.
- AppDynamics could be easier to install.
- AppDynamics could support more programming languages and frameworks.
Pricing
- Infrastructure Monitoring Edition: $6/month per CPU Core
- Premium Edition: $60/month per CPU Core
- Enterprise Edition: $90/month per CPU Core
- Enterprise Edition for SAP® Solutions: $167/month per CPU Core
- Real User Monitoring: $.06/month per 1000 tokens
2. New Relic
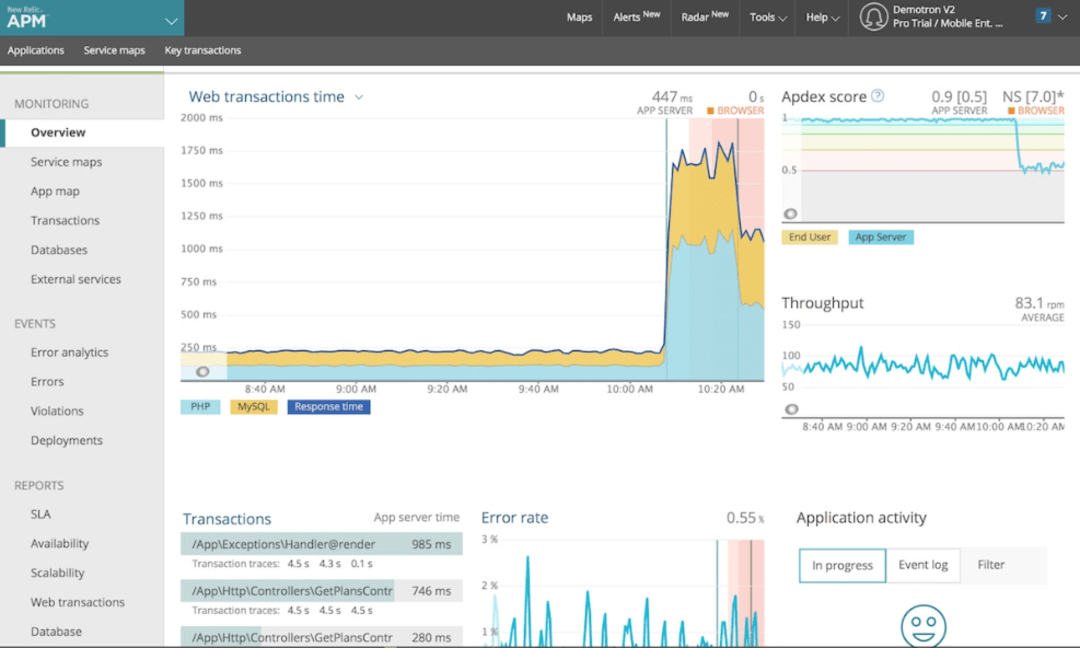
New Relic is a leading software analytics and Application Performance Monitoring (APM) solution designed to help organizations monitor, analyze, and optimize the performance of their digital systems and applications. With the increasing complexity of modern software environments, New Relic offers a comprehensive set of features to gain real-time insights into the health and efficiency of digital services.
The platform provides end-to-end visibility across the entire application stack, from front-end user experiences to backend server performance and external services. Through detailed metrics and transaction tracing, New Relic allows teams to identify performance bottlenecks, errors, and inefficiencies, enabling them to proactively address issues before they impact users.
- Application performance monitoring (APM)
- End-to-end Transaction tracing
- Code-level diagnostics
- Infrastructure monitoring
- Real user monitoring (RUM)
- Application dependencies
- Business intelligence
- Integration and APIs
- Mobile app monitoring
- The tool provides monitoring of system metrics.
- The tool collects data on performance related to applications.
- The software has a great alerting and notification mechanism.
- In comparison to rival products, the pricing is expensive.
- The product's features can be logically grouped together.
Pricing
- Standard: On Request
- Pro: On Request
- Enterprise: On Request
3. Dynatrace
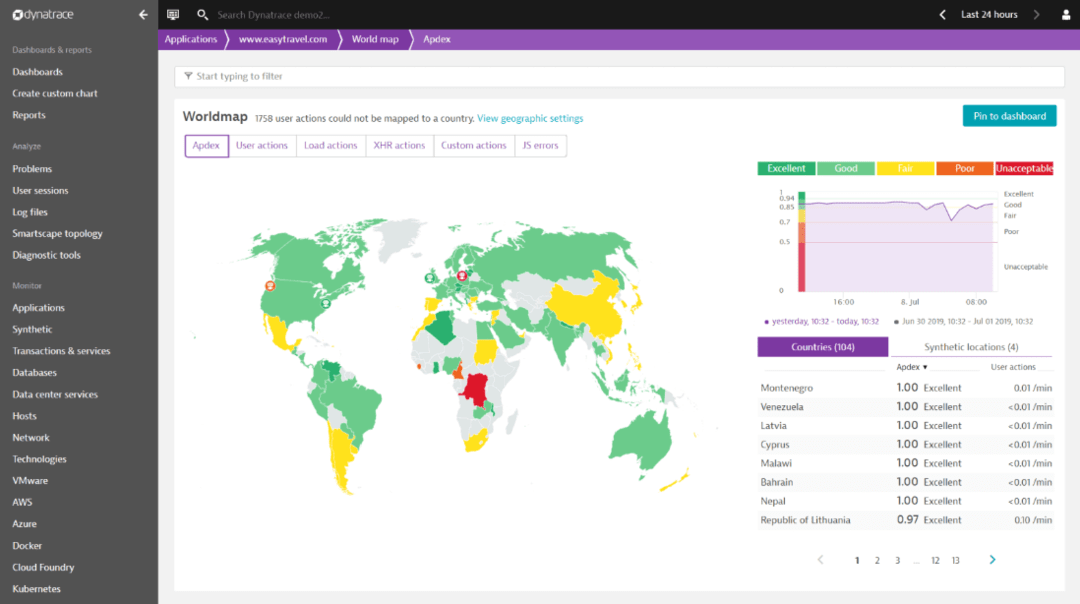
Dynatrace is a leading Application Performance Monitoring platform (APM) and Artificial Intelligence for Operations (AIOps) platform designed to help businesses monitor, optimize, and automate the performance of their applications and IT infrastructure. With the increasing complexity of modern digital ecosystems, Dynatrace offers a comprehensive set of features to gain real-time insights and ensure smooth operations across cloud, on-premises, and hybrid environments.
At its core, Dynatrace provides end-to-end visibility into the entire application stack, from user interactions and frontend components to backend services and databases. Through advanced AI-driven monitoring, it automatically detects and analyzes performance issues, identifying root causes and providing actionable insights for resolution.
- End-to-end Application monitoring
- AI-driven root cause analysis
- Automatic dependency mapping
- Proactive anomaly detection
- Real user monitoring (RUM)
- Infrastructure monitoring
- Cloud and microservices monitoring
- Customizable dashboards and reports
- Mobile app monitoring
- The tool easily integrates with a large array of products.
- The tool has proactive monitoring through self-discovery.
- The tool's AI-driven analytics is amazing.
- The software has the ability to create custom synthetic monitoring workflows.
- License cost is high in some forms of the JVM configuration which becomes very expensive.
- The software should have a framework for tagging.
Pricing
Category
- Host Monitoring
- Full-Stack Monitoring: $0.01 per memory-GiB-hour
- Infrastructure Monitoring: $0.04 per hour for any size host
Application Security
- Runtime Vulnerability Analytics: $0.00225 per memory-GiB-hour
- Runtime Application Protection: $0.00225 per memory-GiB-hour
Digital Experience Monitoring
- Real User Monitoring: $0.00225 per session
- Real User Monitoring with Session Replay: $0.009 per session replay capture
- Real User Monitoring Property: $0.0001 per property per session
- Browser Monitor or Clickpath: $0.009 per synthetic action
- Third-Party Synthetic API Ingestion: $0.001per third-party synthetic result
- HTTP Monitor: $0.001per synthetic request
Logs powered by Grail
- Log Management & Analytics - Ingest & Process: $0.20 per GiB
- Log Management & Analytics - Retain: $0.0007 per GiB-day
- Log Management & Analytics - Query: $0.0035 per GiB-scanned
4. SolarWinds
SolarWinds Application Performance Monitoring (APM) is a powerful and comprehensive solution designed to help businesses monitor and optimize the performance of their applications. With a user-friendly interface and advanced features, SolarWinds APM provides deep visibility into the entire application stack, from frontend to backend components, databases, and user interactions.
The APM tool enables IT teams to track individual user requests through the application, allowing them to identify performance bottlenecks and pinpoint the root cause of issues. Code-level insights empower developers to optimize application code, improving overall performance and user experience.
The platform's application dependency mapping automatically discovers and visualizes the relationships between different application components, facilitating faster troubleshooting and enhancing understanding of complex application architectures.
- Application monitoring
- Transaction tracing
- Code-level insights
- Real user monitoring (RUM)
- Performance baselines and anomaly detection
- Database monitoring
- Application dependency mapping
- Alerts and notifications
- Customizable dashboards and reports
- The software offers real-time monitoring of common OS and application metrics.
- The software provides robust and well-distributed architecture.
- The tool gives constant updates and a specialized support center.
- The tool's database engine requires a lot of tuning and maintenance.
- The software should have more application performance management features.
Pricing
- On Request
5. Stackify Retrace
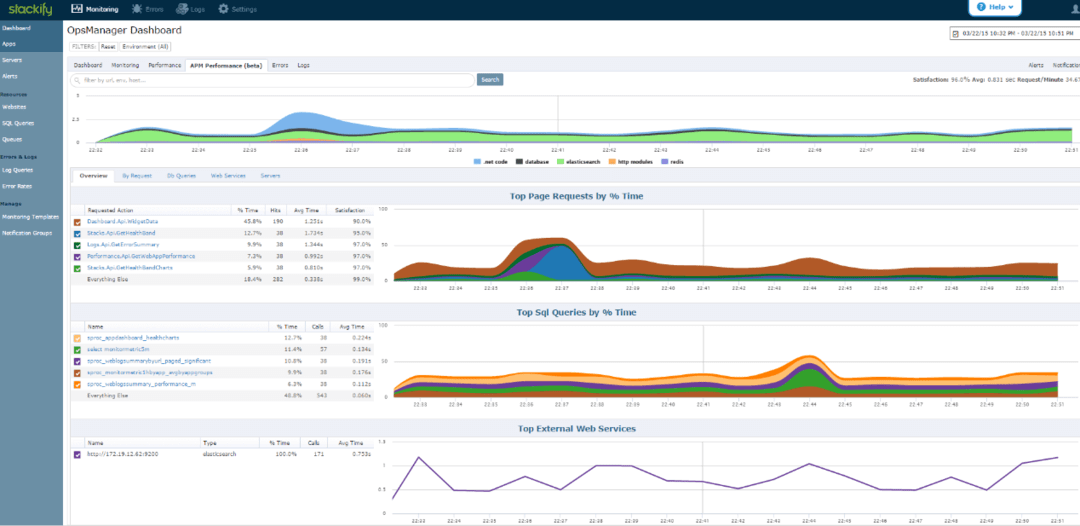
Stackify Retrace is a comprehensive Application Performance software that offers advanced monitoring and diagnostics capabilities for businesses looking to optimize their applications and IT infrastructure. Designed with developers and IT operations in mind, Retrace provides a user-friendly interface and a wide range of features to streamline performance management and troubleshooting processes.
With Retrace, users gain end-to-end visibility into their application stack, from frontend to backend components, databases, and external services. The platform's transaction tracing capabilities allow teams to track individual user requests, facilitating the identification of performance bottlenecks and issues.
- Application visibility
- Transaction tracing
- Code-level diagnostics
- Real user monitoring (RUM)
- Anomaly detection and performance baselines
- Application dependency mapping
- Cloud readiness and scalability
- Team collaboration
- Continuous integration and deployment (CI/CD) support
- The tool has the integration of performance management with log management.
- The tool has in-line log and error data in the trace.
- The tool has very reasonably priced.
- The software needs to improve its mobile support.
- The tool needs documentation improvement.
Pricing
- Consumption-Based: Starts at $9.99/month
- Host Hour Based: Starts at $99/month
Software Related to APM Tools
In today's fast-paced digital landscape, Application Performance Monitoring (APM) tools are essential for organizations to ensure the smooth operation of their applications and deliver a seamless user experience.
Apart from APM tools, several other software solutions complement and enhance application performance monitoring efforts. Here, we will explore three software categories related to APM tools: Network Monitoring Software, Data Center Infrastructure Management (DCIM) Software, and Log Analysis Software.
-
Network Monitoring Software
Network Monitoring Software plays a vital role in APM efforts by focusing on the health and performance of the underlying network infrastructure that supports applications. This software continuously monitors network devices, such as routers, switches, firewalls, and network links, to ensure they are operating optimally.
Network monitoring tools provide real-time insights into bandwidth utilization, latency, packet loss, and network device health. Integrating network monitoring with APM enables organizations to pinpoint network-related performance bottlenecks that may affect application performance. By ensuring the network is running smoothly, businesses can deliver consistent and reliable application experiences to end-users.
-
Data Center Infrastructure Management (DCIM) Software
Data Center Infrastructure Management (DCIM) Software monitors and optimizes data center resources, including power, cooling, space, and overall infrastructure efficiency. In the context of APM, DCIM software plays a critical role in ensuring that the data center environment is conducive to optimal application performance.
By monitoring power and cooling levels, DCIM tools help prevent overheating and potential equipment failures that may impact applications. Additionally, DCIM software provides valuable insights into data center capacity planning, enabling organizations to allocate resources efficiently and scale their infrastructure as needed to accommodate application growth.
-
Log Analysis Software
Log Analysis Software complements APM tools by analyzing logs generated by applications, servers, network devices, and other IT infrastructure components. These logs contain valuable information about application behavior, errors, and performance issues. Log analysis tools aggregate, parse, and analyze logs in real time, helping IT teams identify patterns and anomalies that may affect application performance.
By correlating log data with APM metrics, organizations can gain a holistic view of their application environment and troubleshoot issues more effectively. Log analysis software is particularly useful for identifying root causes of performance problems and monitoring security-related events that could impact application stability.
Challenges with APM Tools
Application Performance Monitoring (APM) tools play a crucial role in modern software development and IT operations, providing insights into the performance and behavior of applications. These tools enable organizations to identify bottlenecks, optimize performance, and enhance user experience.
However, like any technology, APM tools come with their own set of challenges. In this description, we will explore three major challenges faced when dealing with APM tools: programming language incompatibility, variable configuration requirements, and lack of standardization.
-
Programming language incompatibility
One of the primary challenges with APM tools is the compatibility issue arising from the diverse range of programming languages used in the software industry. As applications are developed using different languages, APM tools need to support each of these languages to effectively monitor and analyze the application's performance.
However, not all APM tools are designed to be language-agnostic, leading to limitations in monitoring applications built on less mainstream or emerging programming languages. This can be a significant obstacle for organizations working with polyglot architectures, where multiple programming languages are used within a single application ecosystem.
-
Variable configuration requirements
APM tools offer a wealth of features and customizations to cater to the specific needs of different applications. While this flexibility is advantageous, it also presents challenges related to configuration management. Each application may have unique requirements, and configuring the APM tool to capture relevant data accurately becomes a complex task.
Moreover, the lack of well-defined best practices for configuring APM tools can lead to suboptimal performance monitoring, resulting in the failure to identify critical issues promptly. As a consequence, organizations may need to invest significant time and effort in fine-tuning APM tool configurations to achieve optimal results.
-
Lack of standardization
The APM market is filled with various vendors offering different APM tools, each with its own proprietary interfaces, data formats, and reporting mechanisms. This lack of standardization creates challenges when organizations seek to integrate multiple APM tools into their technology stack or when migrating between different APM solutions.
The absence of a unified standard can lead to data fragmentation, increased complexity, and difficulty in correlating data across different monitoring systems. Consequently, this may hinder the ability to gain a comprehensive view of the application's performance and lead to potential blind spots in the monitoring process.
Trends in Application Performance Monitoring (APM) Tools
As technology and software applications continue to evolve, the importance of Application Performance Monitoring (APM) becomes even more critical. APM tools are instrumental in helping organizations understand and optimize the performance of their applications, ensuring smooth user experiences and efficient operations.
-
AI and Machine Learning Integration
The integration of Artificial Intelligence (AI) and Machine Learning (ML) into APM tools has revolutionized the way applications are monitored and analyzed. Traditional APM solutions rely on predefined thresholds and rules to detect anomalies and performance issues. However, with AI and ML, APM tools can now leverage advanced algorithms to automatically learn and adapt to an application's behavior over time. This enables more accurate anomaly detection, predictive analysis, and automated root cause analysis.
AI-driven APM tools can identify complex patterns and trends that may not be apparent through manual configuration, making them particularly effective in dynamic and complex application environments. By continuously learning from data, these tools can proactively detect and address performance bottlenecks and potential failures, thus helping organizations maintain high application availability and performance.
-
Full-Stack Observability
Modern applications are often complex, distributed, and composed of various interconnected components. Full-stack observability is a trend that emphasizes holistic monitoring, enabling organizations to gain insights into the entire application stack, from infrastructure to user interactions.
Traditional APM tools typically focus on specific application components like server performance or database queries. However, full-stack observability brings together metrics, logs, traces, and other data from all layers of the application stack. This comprehensive approach allows for a better understanding of how different components interact and impact the overall application performance.
With full-stack observability, APM tools empower organizations to identify dependencies, diagnose performance issues across various components, and optimize the application as a whole. This trend has become crucial as modern applications often involve microservices, containers, and cloud-based architectures, where interconnectivity can be highly intricate.
-
Cloud-Native Monitoring
As cloud adoption continues to surge, APM tools have adapted to address the unique challenges posed by cloud-native applications. Cloud environments are dynamic and elastic, with resources being provisioned and de-provisioned automatically. Traditional APM solutions may struggle to keep up with the ephemeral nature of cloud-based applications.
Cloud-native monitoring in APM tools caters specifically to cloud environments, providing seamless integration with popular cloud platforms and container orchestration systems. These tools can auto-discover cloud resources, monitor performance in real-time, and scale accordingly based on demand.
By embracing cloud-native monitoring, organizations can efficiently monitor applications in the cloud, optimize resource allocation, and ensure cost-effectiveness without compromising on performance and user experience.
-
User-Centric Monitoring
Ultimately, the success of an application hinges on how well it serves its users. User-centric monitoring is a trend in APM that places the end-user experience at the forefront of performance evaluation. Traditional metrics like response times and server resource usage remain essential but are complemented by metrics that directly measure user experience.
User-centric APM tools can track user interactions, behavior, and satisfaction levels. Real user monitoring (RUM) and synthetic monitoring are common techniques used to gather data on actual user experiences and simulate user interactions, respectively.
By adopting user-centric monitoring, organizations gain valuable insights into how users perceive their applications, enabling them to identify pain points, prioritize improvements, and enhance overall user satisfaction.
Conclusion
In conclusion, Application Performance Monitoring (APM) solutions have become a critical component of corporate and organizational efforts to guarantee the efficient operation of their applications in a dynamic and intensely competitive environment. APM technologies are essential for providing outstanding user experiences and preserving the overall health of applications since they can identify performance bottlenecks, spot anomalies, and foresee potential problems.
APM systems are anticipated to include more sophisticated features as technology develops, including the integration of AI and machine learning, full-stack observability, cloud-native monitoring, and user-centric monitoring. These developments will further enable businesses to improve performance, reduce processes, and obtain deeper insights into their applications.
FAQs
The cost of application performance monitoring (APM) tools can vary significantly based on several factors, including the scope of features, the scale of deployment, the level of customization required, and the vendor's pricing model.
For small to medium-sized businesses, basic APM solutions may start at a few hundred dollars per month, offering essential monitoring capabilities for a limited number of applications. On the other hand, enterprise-grade APM tools, equipped with advanced features like AI-driven analytics. Additionally, some vendors offer pricing based on a pay-as-you-go model, while others may have tiered pricing plans based on the level of service and support required.
Application performance monitoring (APM) tools can integrate with a wide range of software and systems to provide comprehensive insights into application performance. Common integration points include popular programming languages and frameworks, cloud platforms such as Amazon Web Services (AWS), Microsoft Azure, and Google Cloud Platform (GCP), container orchestration systems like Kubernetes and Docker, databases like MySQL, PostgreSQL, and MongoDB, web servers like Apache and Nginx, messaging systems like Apache Kafka and RabbitMQ, and logging and analytics platforms such as Elasticsearch, Logstash, and Kibana (ELK stack).